How It Works
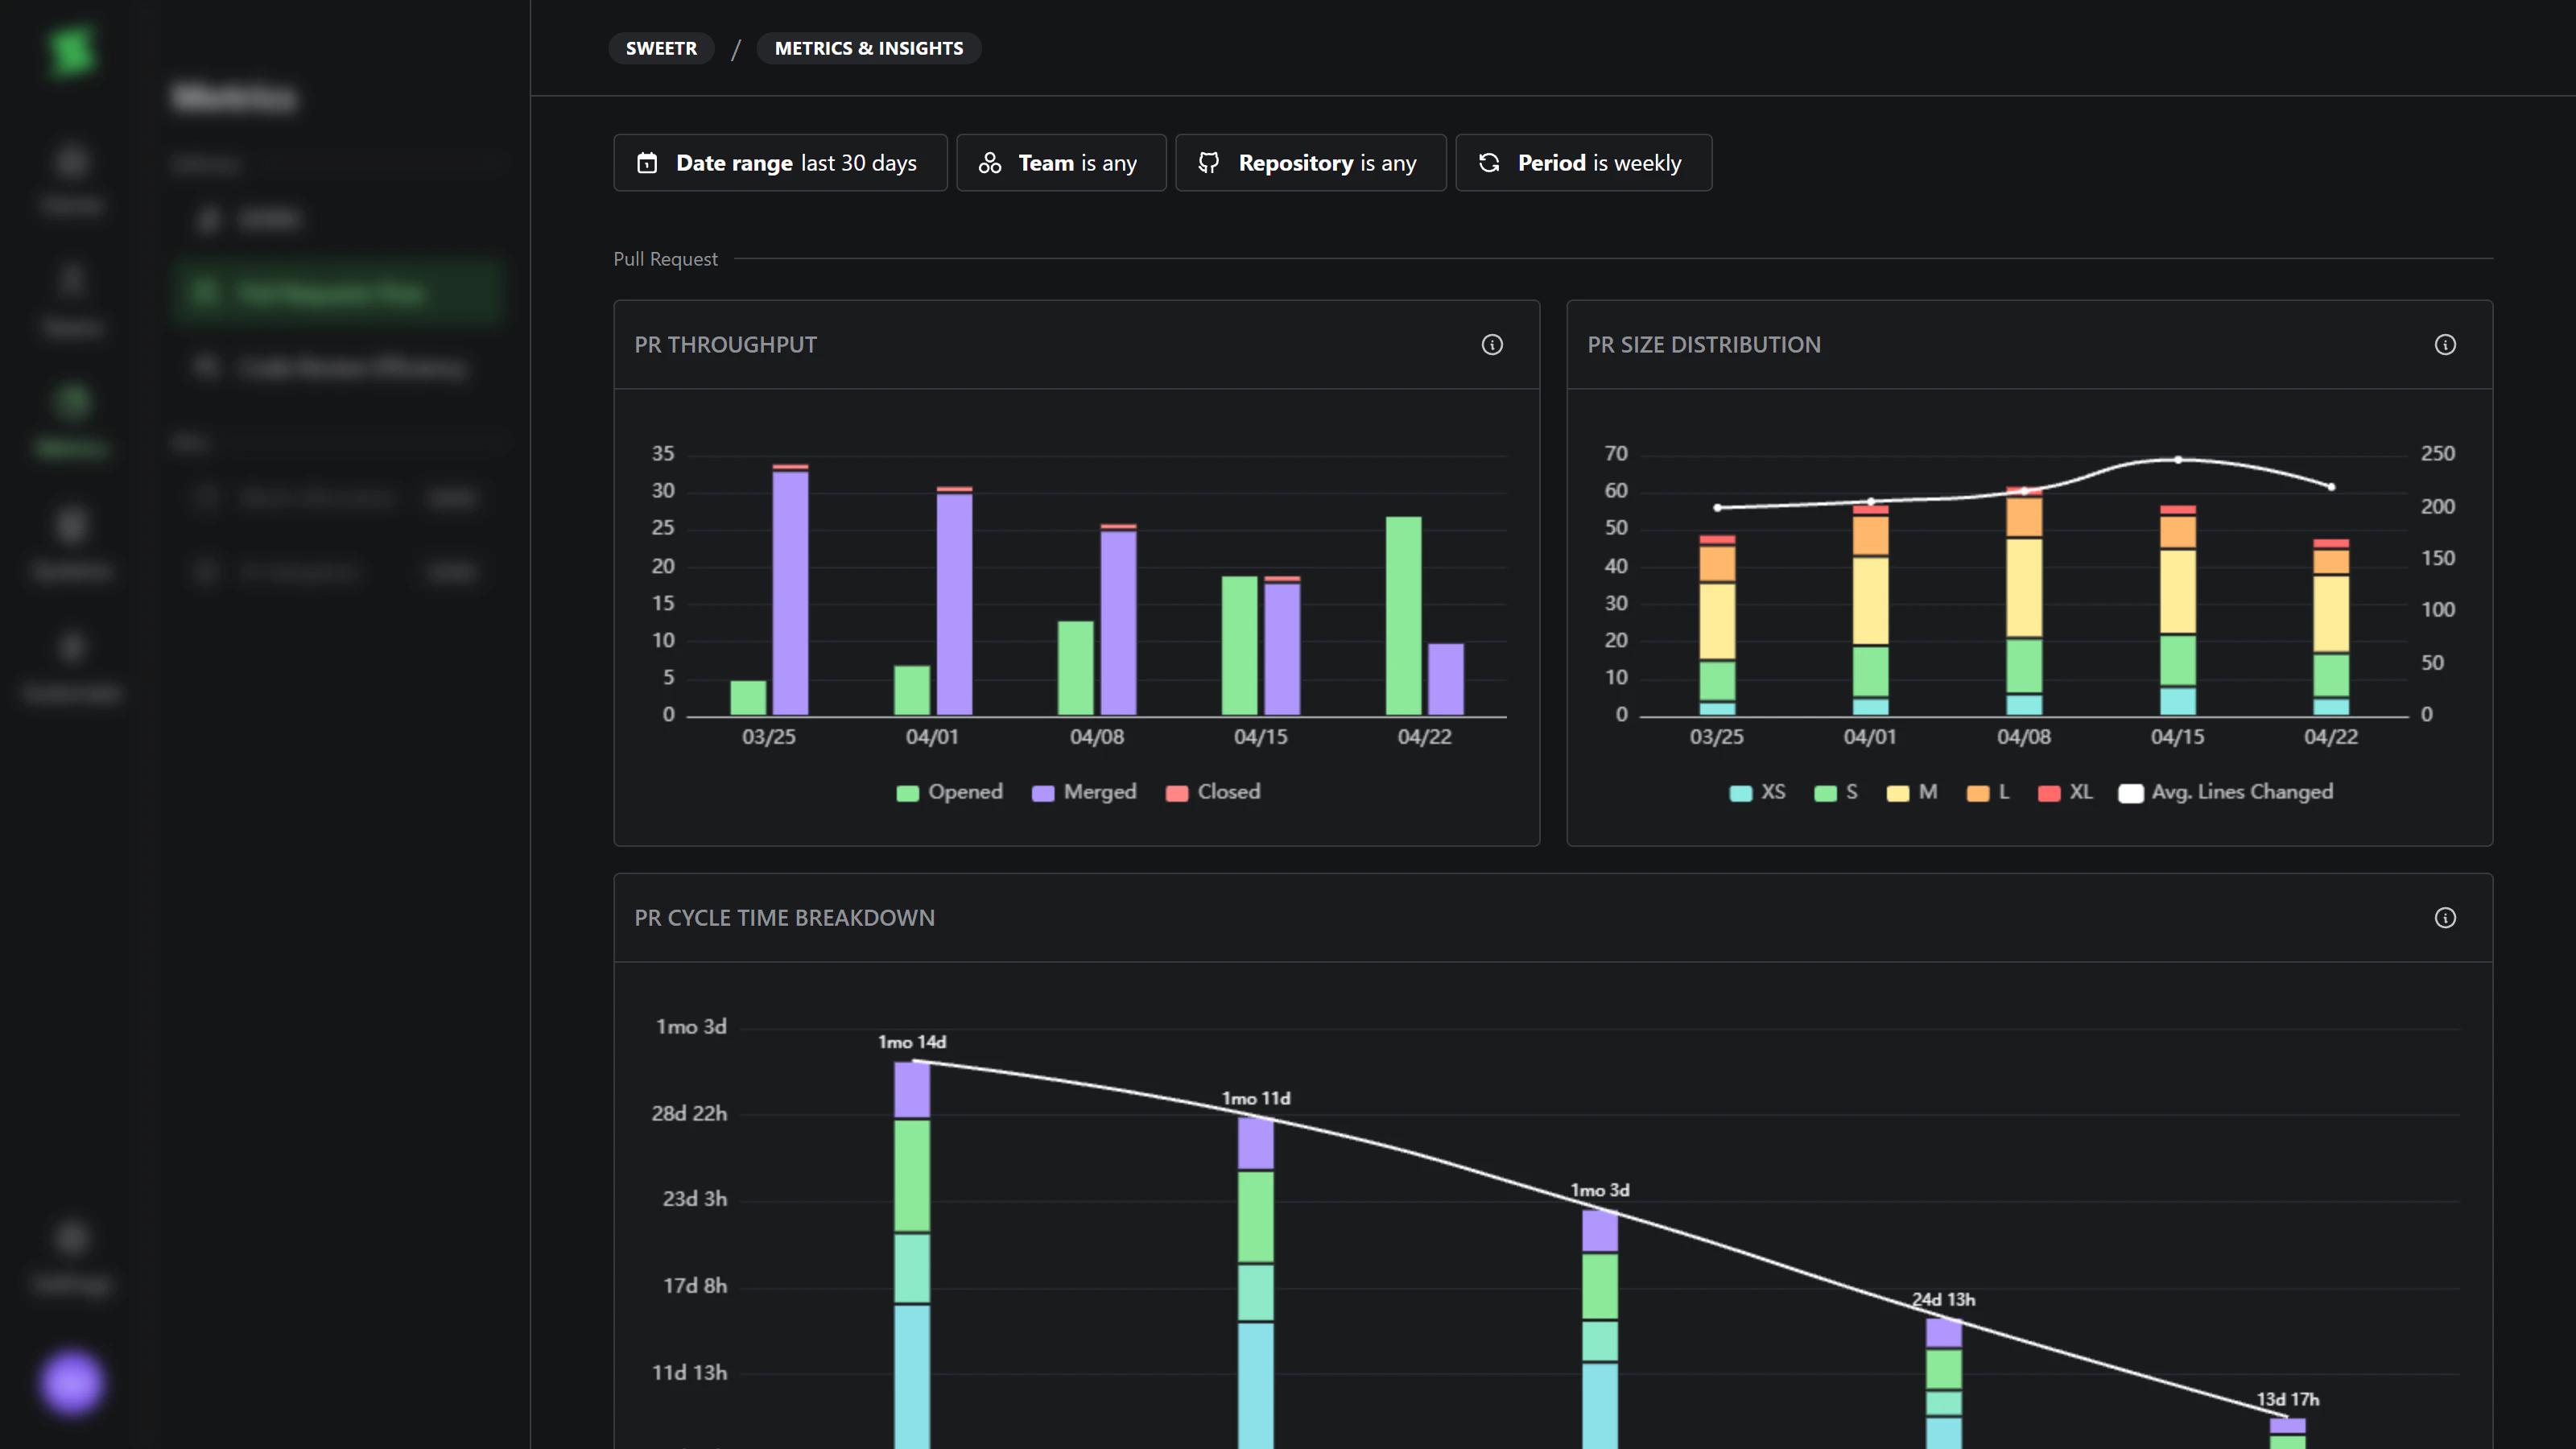
The Pull Request flow dashboard visualizes how your team ships code: throughput, batch size, and where cycle time is spent. All charts respect the same filters at the top of the page:- Date range — the window of PRs to include.
- Team — filter by PR author’s team membership. Multi-select.
- Repository — filter by repository. Multi-select.
- Period — group the time axis as daily, weekly, monthly, quarterly, or yearly.
Explore
PR Throughput
PR Size Distribution
PR Cycle Time Breakdown
PR Size vs Cycle Time
Team Overview
Bad Practices
It’s very important to know how this data should not be used.- Do not stack rank developers or teams by throughput or cycle time.
- Do not optimize a single metric in isolation — faster merges with fewer reviews is not a win.
- Do not treat throughput as a productivity score; it ignores complexity, quality, and risk.