Demo
How it works
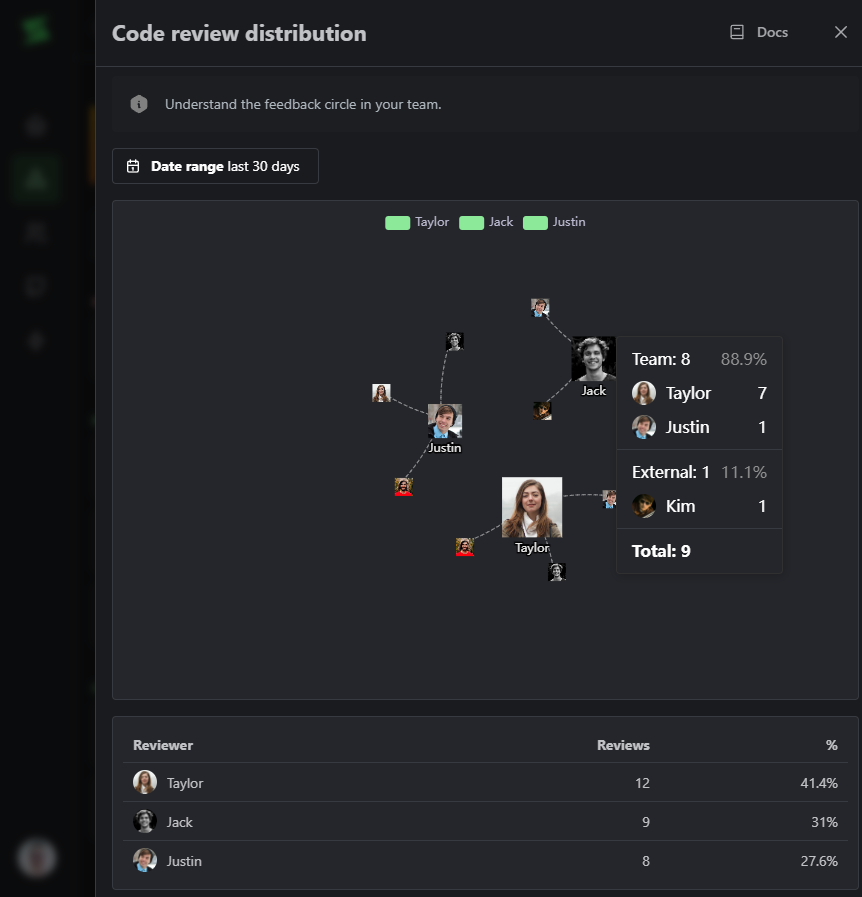
Each named node represents a reviewer (Justin, Taylor, and Jack). They are connected to the people whose PRs they reviewed. You can hover over each reviewer to see detailed info on:- Whose PRs they review the most.
- Distribution of reviews for the team vs. external.
Insights
This chart can help you measure and answer questions like:- Is anyone at risk of burning out due to review overload?
- Could anyone help with more code reviews?
- Is any reviewer interacting only with selected members of the team?
- Is considerable time being spent on reviewing other team’s code?
- Is our strategy to assign reviewers effective?
What good looks like
Each team is very unique, only through iteration can your team find ways to improve its flow and satisfaction. In general, teams strive to have a somewhat balanced load of reviews for each developer. Naturally, more senior developers might be doing more reviews compared to other team members. What matters most is that everyone is contributing, knowledge is spreading, and the team is moving with unity.How to improve
There are some strategies you can employ to try to achieve a more balanced review distribution.- Visit this data during retrospectives and discuss options with the team.
- Discuss code review accountability during 1:1s and performance evaluations.
- Encourage new developers to review code early on their onboarding - even if only to ask questions.
- Make sure your team feels safe giving feedback. Go through your team’s Pull Requests to assert your team members have a healthy communication style.
Bad practices
It’s very important to know how this data should not be used.- Do not evaluate review quality based on quantity.
- Do not evaluate performance based solely on review quantity.
- Do not use this data to stack rank developers.
Ready to unlock continuous improvement in your team?