> ## Documentation Index
> Fetch the complete documentation index at: https://docs.sweetr.dev/llms.txt
> Use this file to discover all available pages before exploring further.
# Intro
> How work moves through your team, from first commit to merge.
export const CtaGetStarted = ({label = "Ready to make delivery flow again?"}) => ;
 ## How It Works
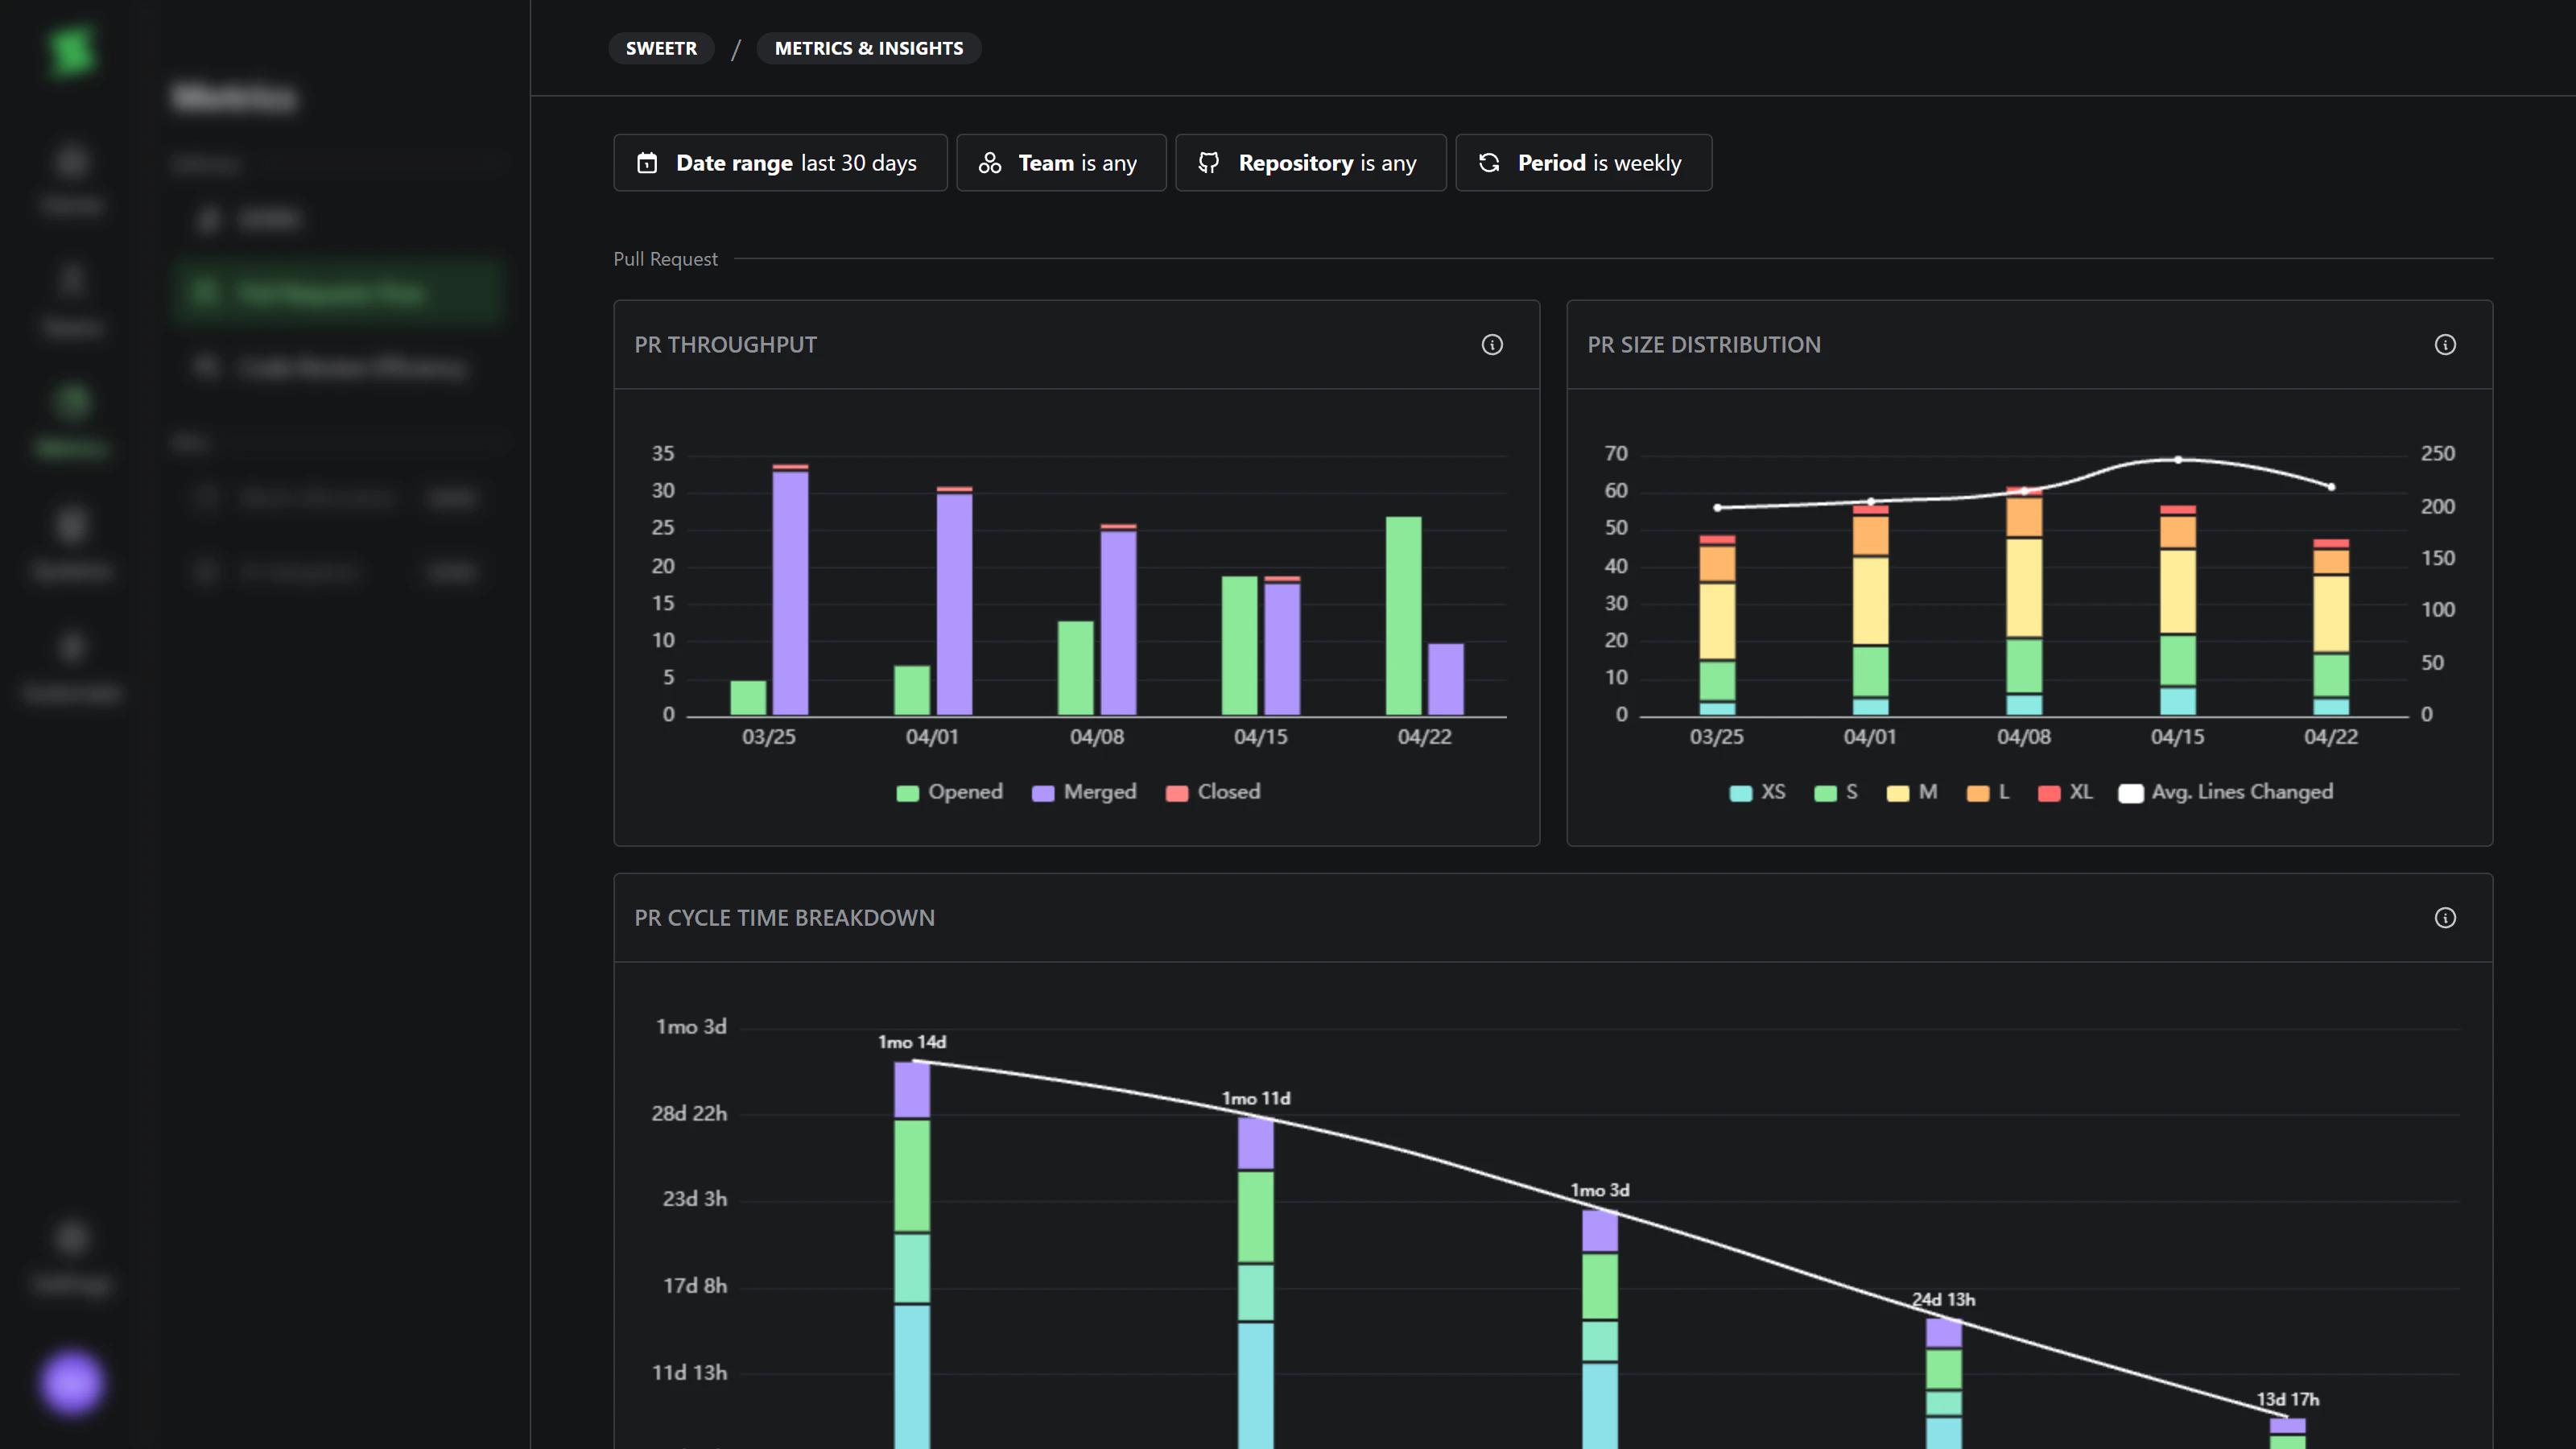
The **Pull Request flow** dashboard visualizes how your team ships code: throughput, batch size, and where cycle time is spent. All charts respect the same filters at the top of the page:
* **Date range** — the window of PRs to include.
* **Team** — filter by PR author's team membership. Multi-select.
* **Repository** — filter by repository. Multi-select.
* **Period** — group the time axis as daily, weekly, monthly, quarterly, or yearly.
Unless noted otherwise, charts include **merged PRs** whose **merge** falls inside the selected date range.
## Explore
## Bad Practices
It's very important to know how this data should **not** be used.
* **Do not** stack rank developers or teams by throughput or cycle time.
* **Do not** optimize a single metric in isolation — faster merges with fewer reviews is not a win.
* **Do not** treat throughput as a productivity score; it ignores complexity, quality, and risk.
## Related
## How It Works
The **Pull Request flow** dashboard visualizes how your team ships code: throughput, batch size, and where cycle time is spent. All charts respect the same filters at the top of the page:
* **Date range** — the window of PRs to include.
* **Team** — filter by PR author's team membership. Multi-select.
* **Repository** — filter by repository. Multi-select.
* **Period** — group the time axis as daily, weekly, monthly, quarterly, or yearly.
Unless noted otherwise, charts include **merged PRs** whose **merge** falls inside the selected date range.
## Explore
## Bad Practices
It's very important to know how this data should **not** be used.
* **Do not** stack rank developers or teams by throughput or cycle time.
* **Do not** optimize a single metric in isolation — faster merges with fewer reviews is not a win.
* **Do not** treat throughput as a productivity score; it ignores complexity, quality, and risk.
## Related
