
{label}
 ## How it works
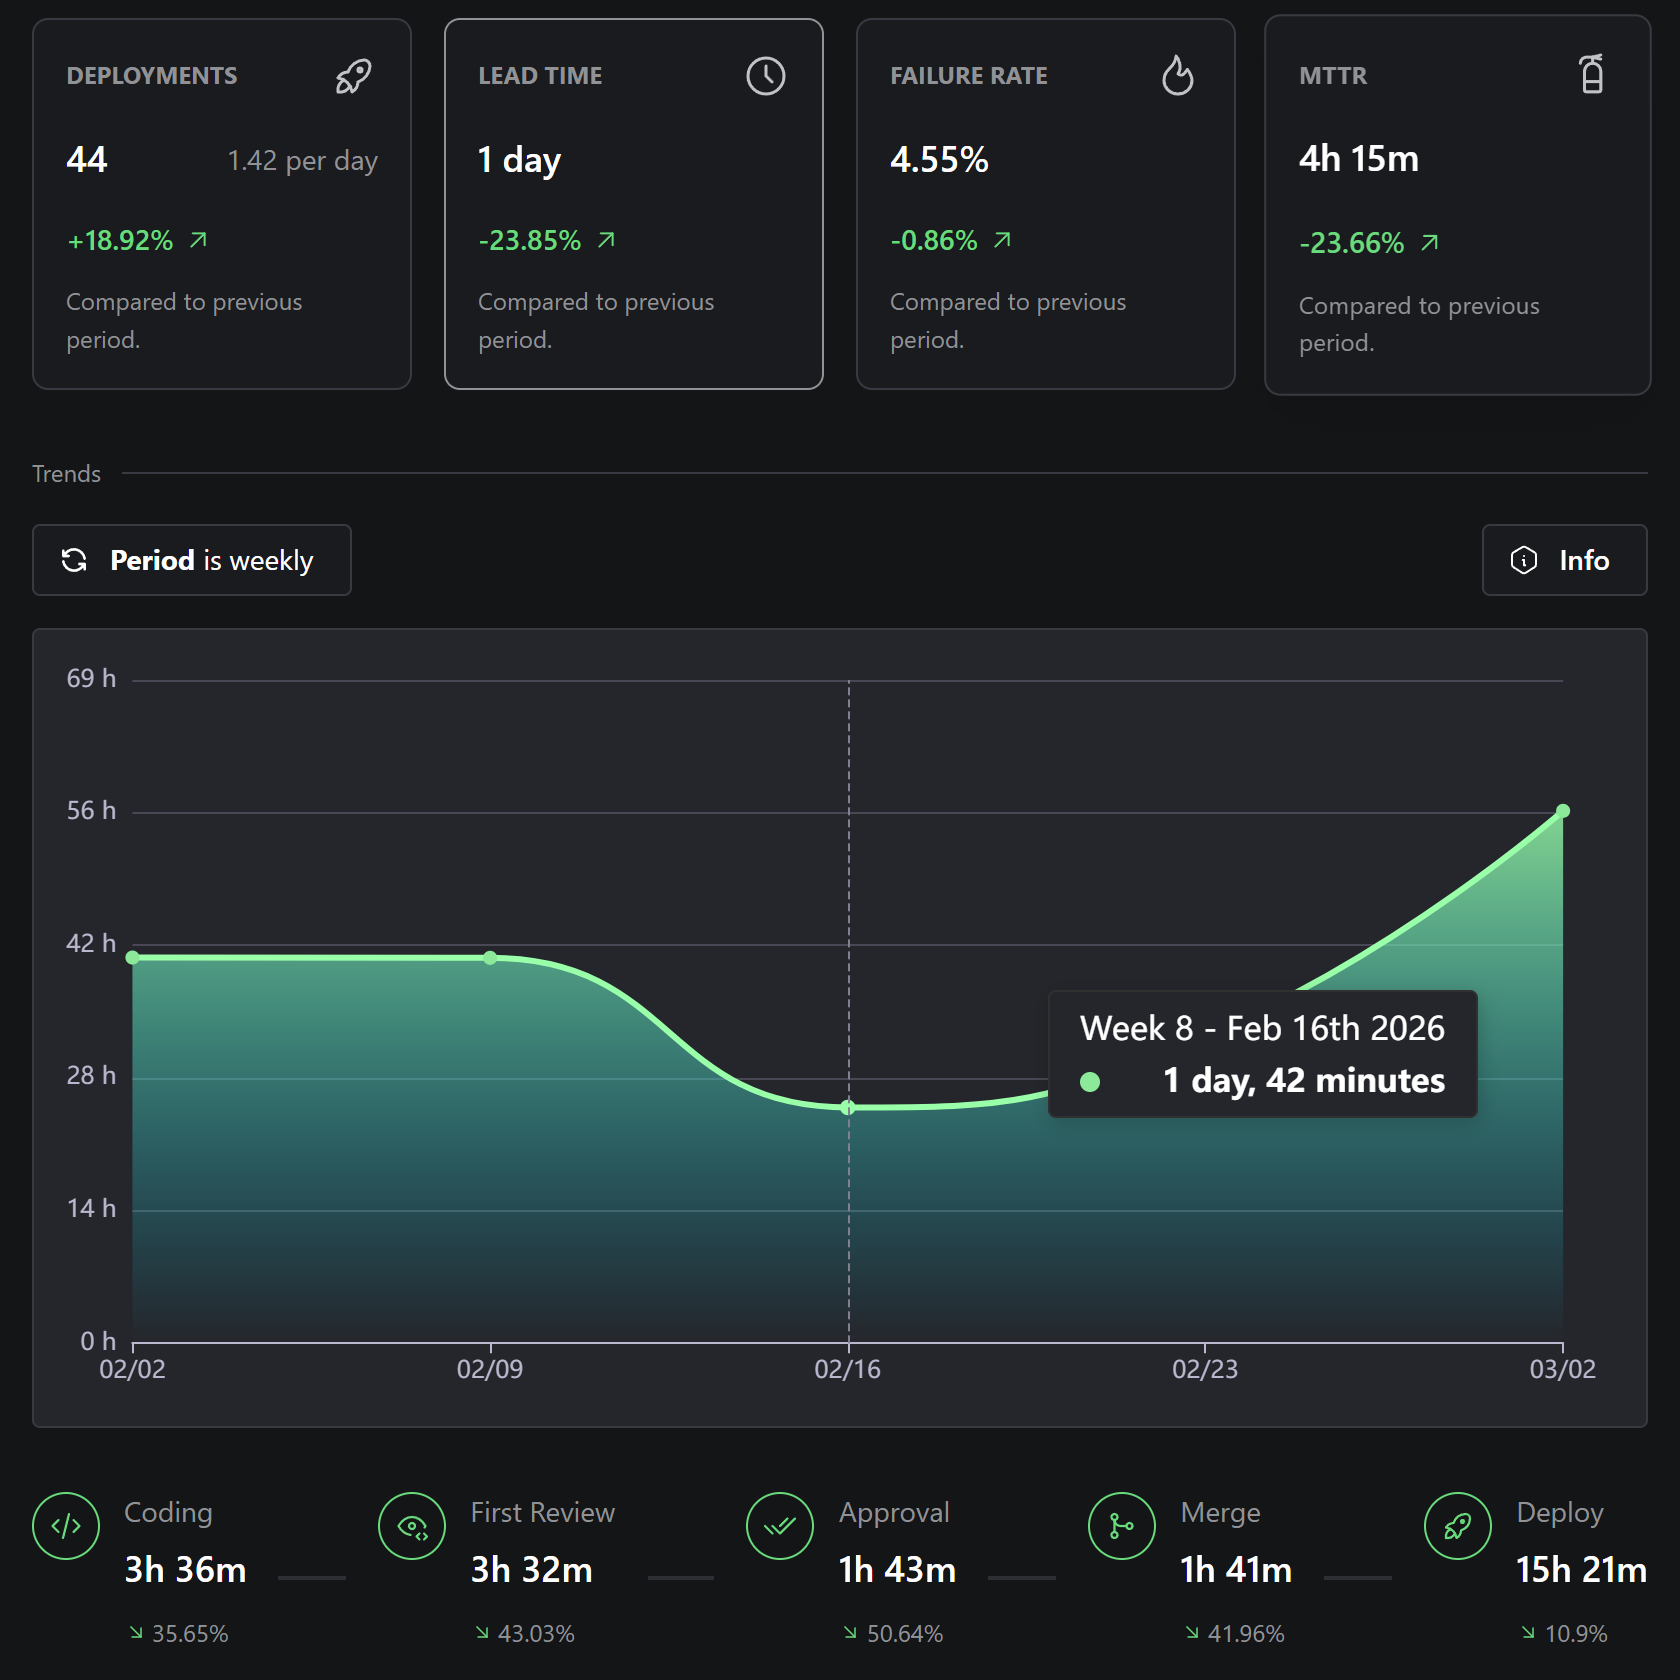
DORA metrics are four key indicators of software delivery performance, developed by the [DORA research program](https://dora.dev). Sweetr calculates these metrics from your deployment and incident data.
All metrics support filtering by **team**, **application**, **environment**, and **date range**, and include a comparison against the previous period.
## Metrics
### Deployment Frequency
How often your team deploys to production. Higher frequency indicates smaller, more manageable releases.
* **Calculation:** Count of deployments in the selected period.
* **Chart:** Deployments over time with average per day.
### Lead Time for Changes
The time from first commit to production deployment. Lower lead time means faster delivery.
* **Calculation:** Time from first commit to deployment, averaged across all deployments.
* **Breakdown:**
* **Coding time**: First commit to pull request creation.
* **Time to first review**: PR creation to first review.
* **Time to approve**: First review to approval.
* **Time to merge**: Approval to merge.
* **Time to deploy**: Merge to deployment.
### Change Failure Rate
The percentage of deployments that cause an incident. Lower rate indicates more stable releases.
* **Calculation:** `(Incidents caused by deployments / Total deployments) × 100`
* **Requires:** [Incidents](/platform/incidents) linked to deployments.
### Mean Time to Recovery (MTTR)
The average time to recover from an incident. Lower MTTR indicates faster incident response.
* **Calculation:** Average of `resolved at - detected at` across all resolved incidents.
* **Requires:** [Incidents](/platform/incidents) with detection and resolution timestamps.
## Benchmarks
The DORA research program publishes annual benchmarks that categorize teams into Elite, High, Medium, and Low performers. Use these to assess where your team stands and set realistic goals. See the official DORA guides for the latest thresholds.
## Prerequisites
To get the most out of DORA metrics:
## How it works
DORA metrics are four key indicators of software delivery performance, developed by the [DORA research program](https://dora.dev). Sweetr calculates these metrics from your deployment and incident data.
All metrics support filtering by **team**, **application**, **environment**, and **date range**, and include a comparison against the previous period.
## Metrics
### Deployment Frequency
How often your team deploys to production. Higher frequency indicates smaller, more manageable releases.
* **Calculation:** Count of deployments in the selected period.
* **Chart:** Deployments over time with average per day.
### Lead Time for Changes
The time from first commit to production deployment. Lower lead time means faster delivery.
* **Calculation:** Time from first commit to deployment, averaged across all deployments.
* **Breakdown:**
* **Coding time**: First commit to pull request creation.
* **Time to first review**: PR creation to first review.
* **Time to approve**: First review to approval.
* **Time to merge**: Approval to merge.
* **Time to deploy**: Merge to deployment.
### Change Failure Rate
The percentage of deployments that cause an incident. Lower rate indicates more stable releases.
* **Calculation:** `(Incidents caused by deployments / Total deployments) × 100`
* **Requires:** [Incidents](/platform/incidents) linked to deployments.
### Mean Time to Recovery (MTTR)
The average time to recover from an incident. Lower MTTR indicates faster incident response.
* **Calculation:** Average of `resolved at - detected at` across all resolved incidents.
* **Requires:** [Incidents](/platform/incidents) with detection and resolution timestamps.
## Benchmarks
The DORA research program publishes annual benchmarks that categorize teams into Elite, High, Medium, and Low performers. Use these to assess where your team stands and set realistic goals. See the official DORA guides for the latest thresholds.
## Prerequisites
To get the most out of DORA metrics: