> ## Documentation Index
> Fetch the complete documentation index at: https://docs.sweetr.dev/llms.txt
> Use this file to discover all available pages before exploring further.

# Intro

> How your team reviews code — who's involved, how fast, and how deep.

export const CtaGetStarted = ({label = "Ready to make delivery flow again?"}) => <div style={{
  display: "flex",
  justifyContent: "space-between",
  alignItems: "center",
  marginTop: 80,
  background: "#1a1b1e",
  color: "#fff",
  borderRadius: 8,
  border: "1px solid #69db7c",
  padding: "10px"
}}>
    <div style={{
  display: "flex",
  justifyContent: "space-between",
  alignItems: "center",
  gap: 12,
  fontWeight: 500
}}>
      <img src="https://mintlify.s3-us-west-1.amazonaws.com/sweetrdev/logo.svg" height={24} width={24} style={{
  margin: 0
}} />
      <div>{label}</div>
    </div>
    <a href="https://github.com/apps/sweetr-dev/installations/new" rel="nofollow" className="not-prose" style={{
  padding: "8px 16px",
  background: "#69db7c",
  color: "#000",
  borderRadius: 4,
  fontSize: 14
}}>
      Try now
    </a>
  </div>;

<Frame>
  <img src="https://mintcdn.com/sweetrdev/XBMTRulC27kvIYzh/images/code-review-efficiency.png?fit=max&auto=format&n=XBMTRulC27kvIYzh&q=85&s=361d7343d7dc1e89fd41f856d6e1a017" width="3200" height="1800" data-path="images/code-review-efficiency.png" />
</Frame>

## How It Works

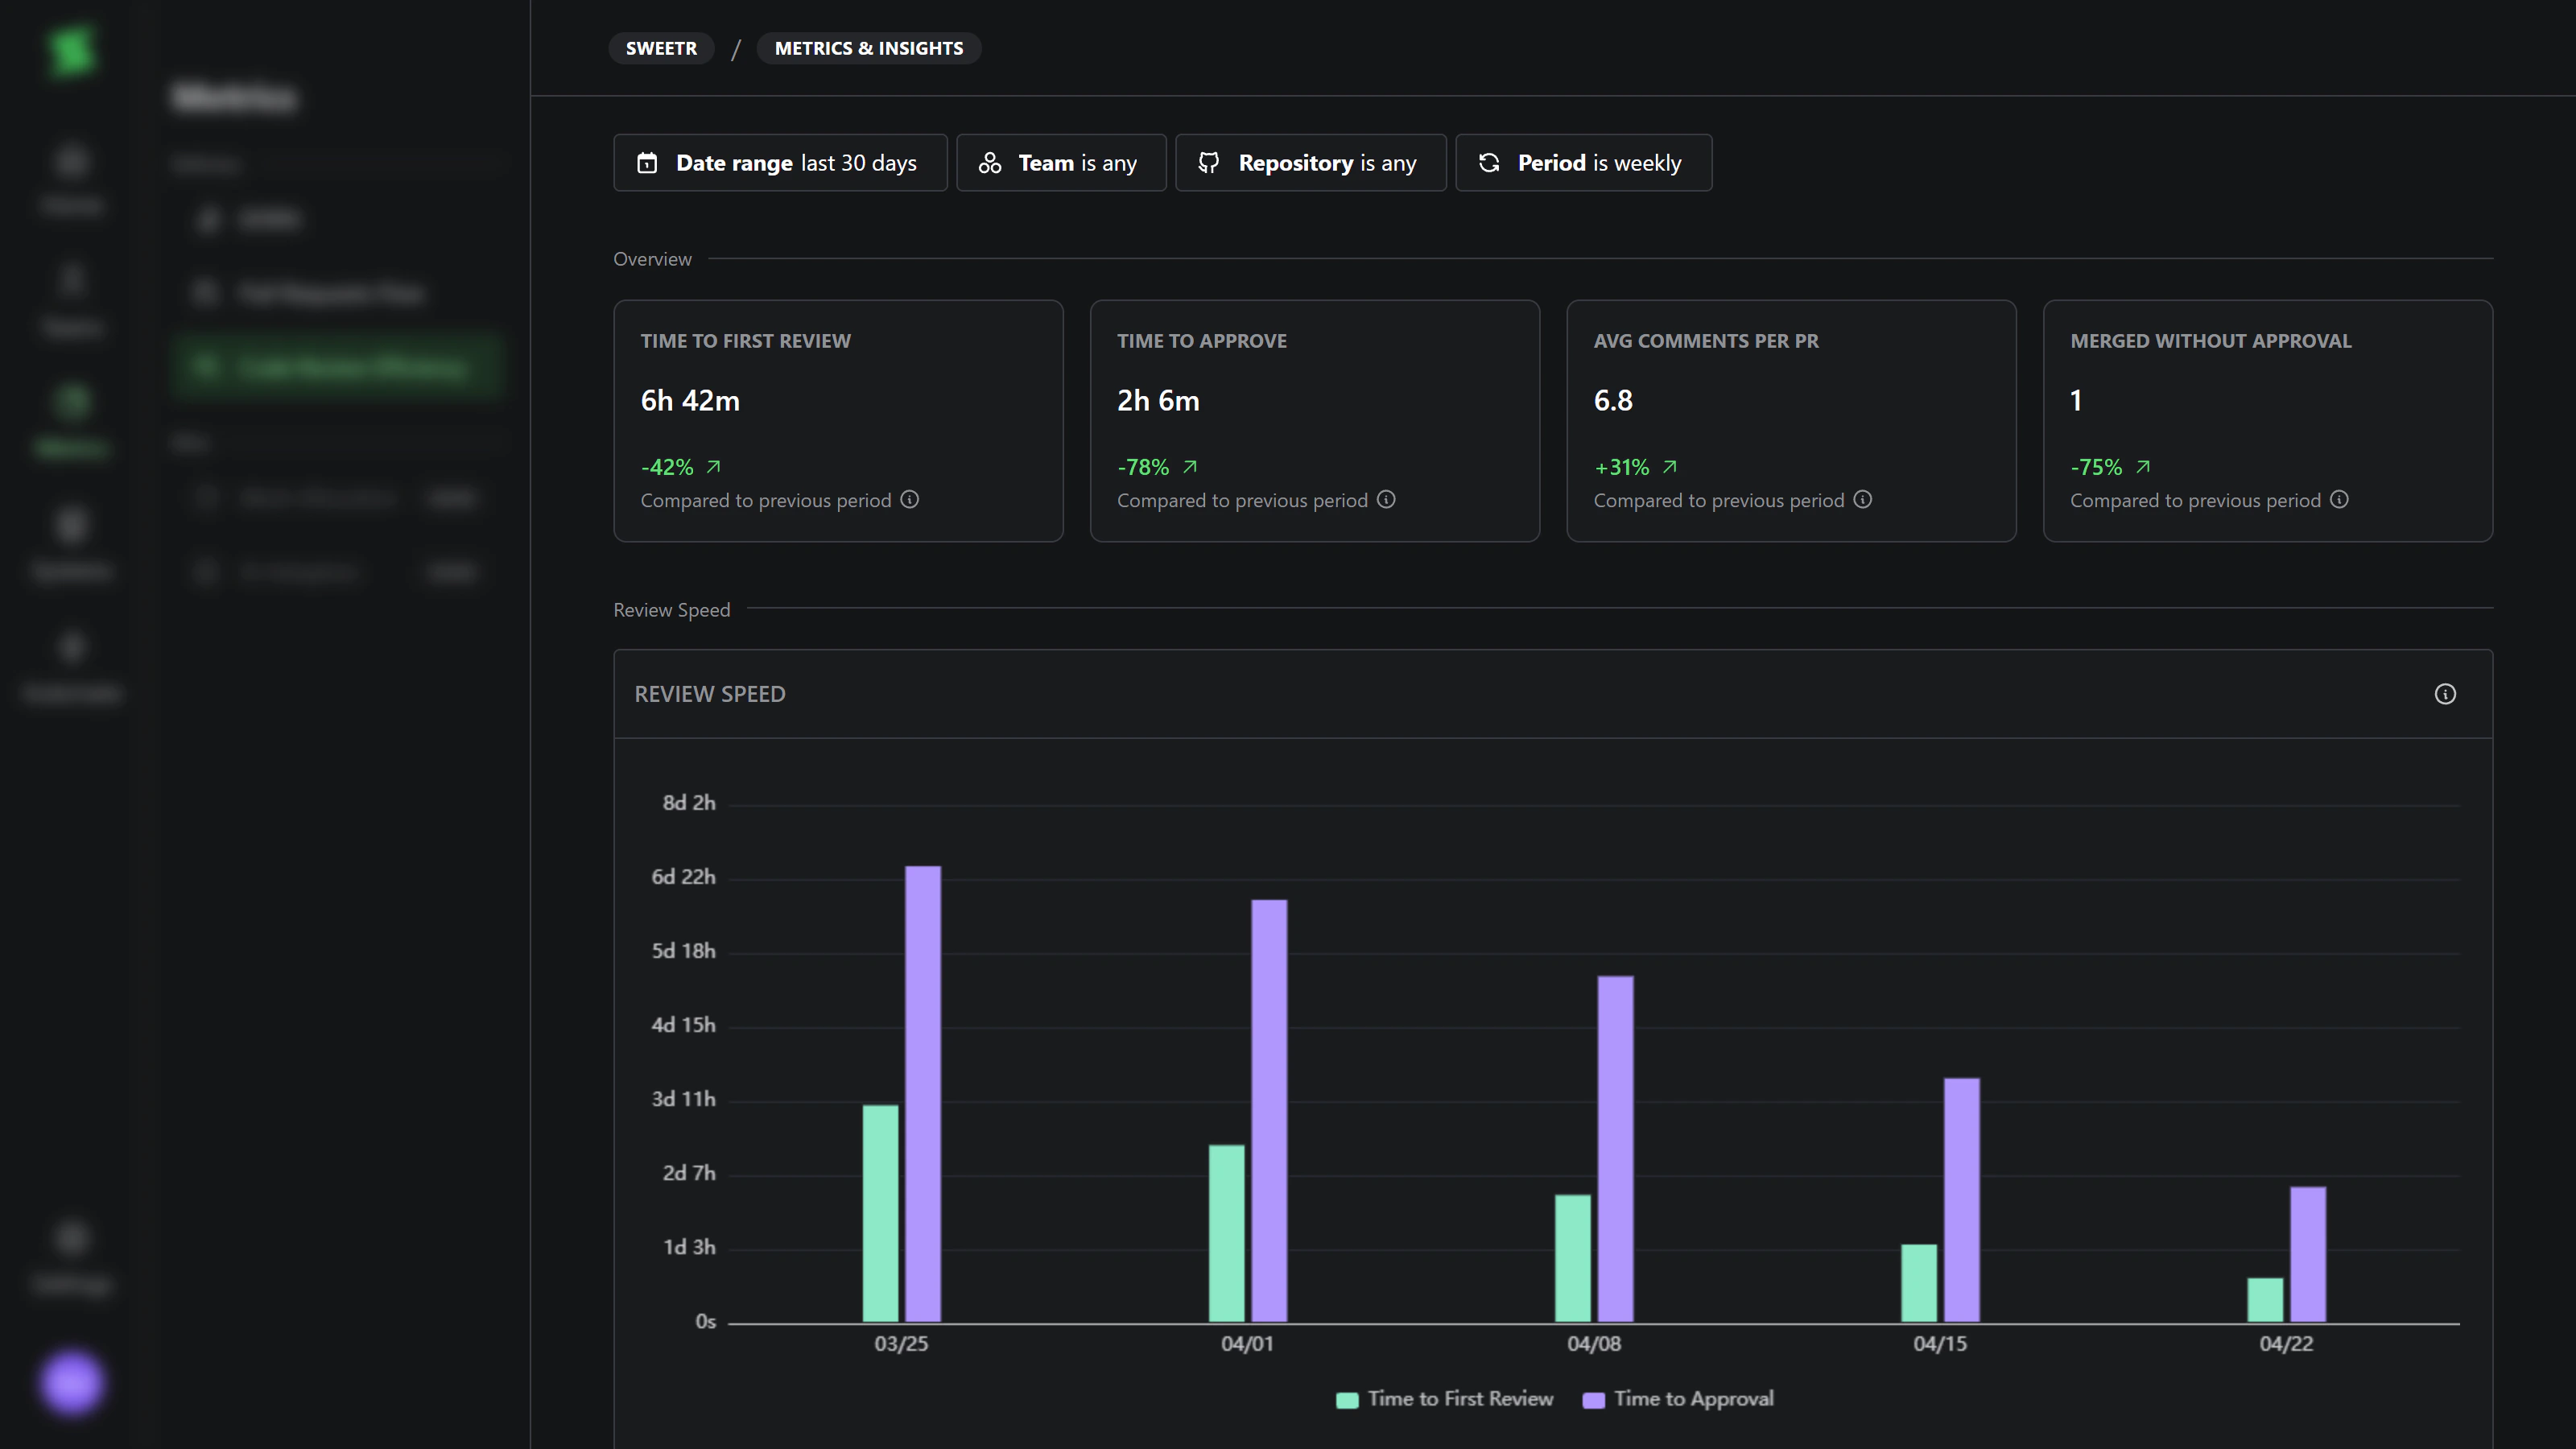
The **Code review efficiency** dashboard focuses on the review stage of the PR lifecycle. It answers three questions at once: *how fast* reviews happen, *how deep* they are, and *who* is doing them. All charts respect the same filters at the top of the page:

* **Date range** — the window of PRs and reviews to include.
* **Team** — filter by PR author's team membership. Multi-select.
* **Repository** — filter by repository. Multi-select.
* **Period** — group the time axis as daily, weekly, monthly, quarterly, or yearly.

Most charts are scoped to **merged PRs**. The **Review distribution** graph uses all code reviews in the range (merged or not).

## Explore

<CardGroup cols={2}>
  <Card title="KPIs" href="/metrics-and-insights/code-review-efficiency/kpis" />

  <Card title="Review Speed" href="/metrics-and-insights/code-review-efficiency/review-speed" />

  <Card title="Team Overview" href="/metrics-and-insights/code-review-efficiency/team-overview" />

  <Card title="PR Size vs Comments" href="/metrics-and-insights/code-review-efficiency/pr-size-vs-comments" />

  <Card title="Review Distribution" href="/metrics-and-insights/code-review-efficiency/review-distribution" />
</CardGroup>

## Bad Practices

It's very important to know how this data should **not** be used.

* **Do not** evaluate review quality based on quantity.
* **Do not** stack rank developers by review count, speed, or comments.
* **Do not** obsess over a single KPI — drive review speed to zero and you'll lose the value of review itself. Strive for a good balance of quality and speed.

## Related

<CardGroup cols={2}>
  <Card title="Pull Request Flow" href="/metrics-and-insights/pr-flow/intro" />

  <Card title="DORA Metrics" href="/metrics-and-insights/dora" />

  <Card title="Pull Requests" href="/platform/pull-requests" />

  <Card title="Code Reviews" href="/platform/code-reviews" />
</CardGroup>

<CtaGetStarted />
